Our Solutions
Areas for Solutions
Every operation is different — but the challenges tend to fall into a few broad categories.
Rather than selling point solutions or pre-packaged software, GrowthWorks Systems works across these core areas to help teams gain clarity, reduce friction, and make better decisions faster.
PRESENCE
Custom Websites
10–14 days from kickoff to live.
CRM & Pipelines
Your CRM on your phone. Auto-reviews. Win-back.
Voice & Chatbots
First voice agent live in 7–10 days.
SEO & AEO
Rank higher on Google. Show up in AI answers.
Blog & Editorial
4 posts a month. Reads like a person wrote it.
ACQUISITION
Paid Ads
Google, Facebook, LinkedIn. Tracked end-to-end.
Outbound
LinkedIn DMs and cold email. Replies routed to your inbox.
Lifecycle Email
Welcome flows, broadcasts, win-back emails.
SOFTWARE
Custom Apps
Field-ops, dashboards, internal tools.
Platforms
Multi-user platforms with secure login.
Automation
8–12 workflows wired up in 14–21 days.
STUDIO
Long-form
Podcast + interview editing.
Short-form
Reels · TikTok · Shorts.
Social Posts
LinkedIn carousels, Instagram graphics, X cards.
Ad Creative
Ad variants for Google, Facebook, LinkedIn.
From Strategy to Execution
While the solution areas above describe where we work, the real value comes from how insight is delivered day-to-day.
Below is how we typically layer on our solutions, followed by what clients might typically see early in an engagement: a unified operational dashboard and an automated decision workflow.
Example
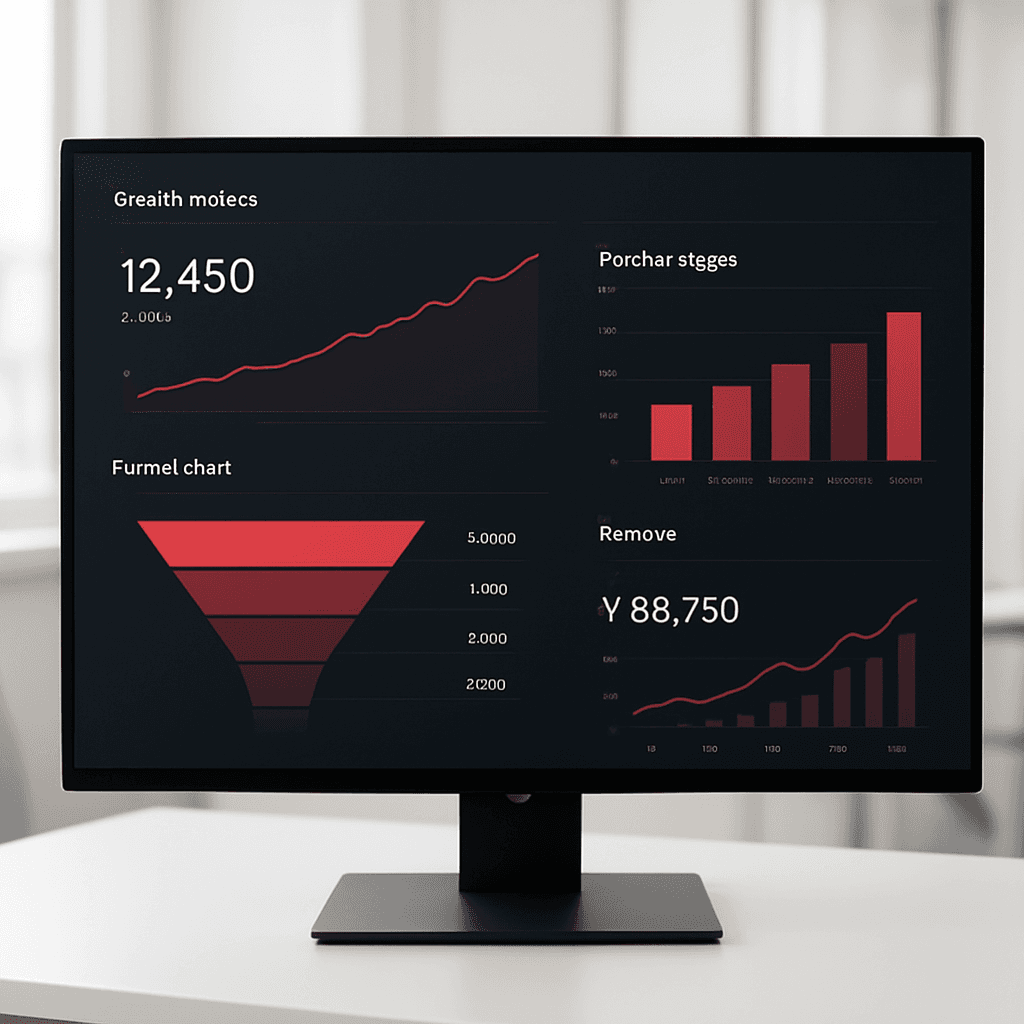
Demand Forecasting & Production Planning Dashboard
This dashboard brings together demand signals, production schedules, inventory coverage, and capacity constraints into a single operational view.
Instead of static reports, teams gain:
- Forward-looking visibility into demand spikes and risk weeks
- Early warnings when capacity or packaging becomes constrained
- A shared source of truth across planning, operations, and leadership
Dashboards like this often form the foundation — creating clarity before more advanced analytics and automation are layered in.
Example
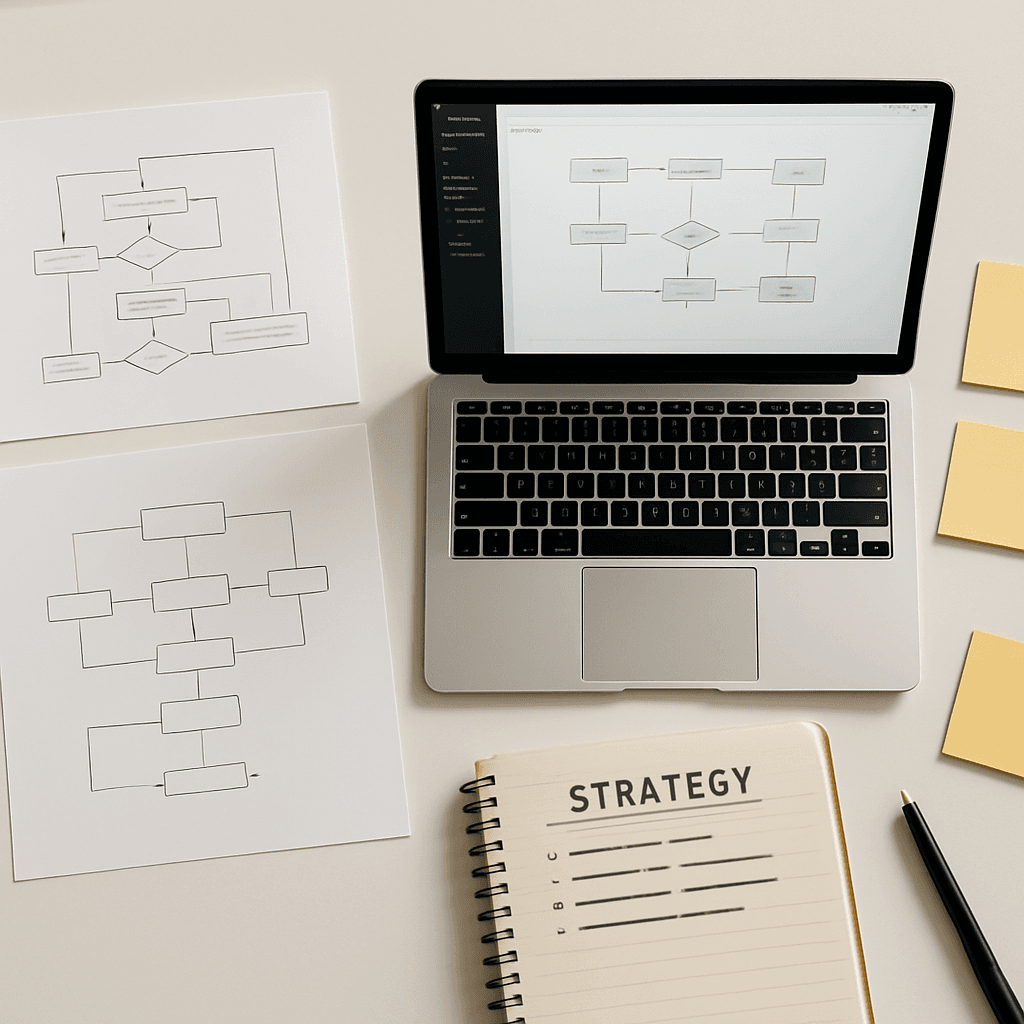
Automated Bottleneck Detection & Escalation
Operational issues rarely fail all at once. They surface as subtle signals — throughput drifting on a line, recurring micro-stoppages, or unexplained downtime that compounds over a shift.
This workflow continuously ingests production throughput and downtime data, aggregates it as time-series signals, and analyzes patterns to detect emerging anomalies.
When a potential bottleneck is identified, it is automatically classified by severity and routed accordingly:
- Low-severity issues are logged for visibility and trend analysis
- Higher-severity events trigger real-time alerts to operations teams
- Critical incidents escalate immediately via SMS to ensure rapid response
Instead of relying on manual monitoring or after-the-fact reports, teams receive early, contextual alerts — allowing them to intervene before bottlenecks cascade into missed production targets or late orders.
Designed to Fit Your Operation
These examples are not templates or off-the-shelf products. They illustrate how GrowthWorks Systems helps organizations move from fragmented data to shared visibility — and from visibility to action.
We start broad, focus where it matters most, and deliver value incrementally.
We are not a vendor. We are an invested partner in your success.